etci2021
ETCI 2021 Competition on Flood Detection
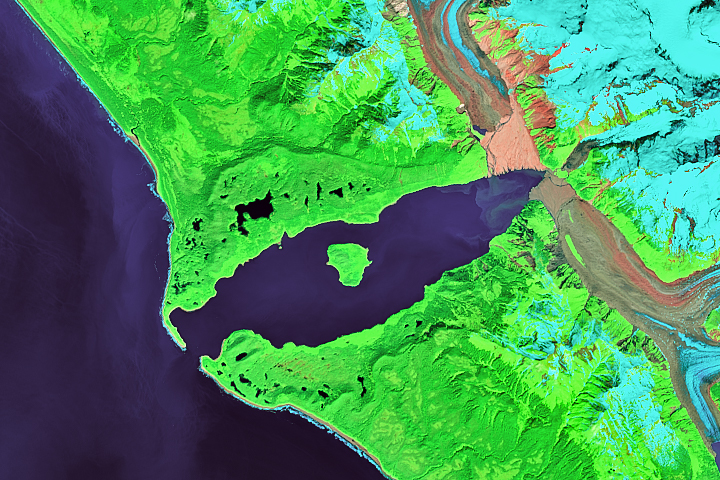
Lituya Bay’s Apocalyptic Wave (Credit: NASA) ![]()
The Challenge
The flood event detection contest, organized by the NASA Interagency Implementation and Advanced Concepts Team in collaboration with the IEEE GRSS Earth Science Informatics Technical Committee, seeks to develop approaches to delineate open water flood areas as an effort to identify flood extent, an impactful disaster that occurs frequently throughout the world. The competition involves a supervised learning task—participants will develop algorithms to identify flood pixels after training their algorithm against a training set of synthetic aperture radar (SAR) images. Participants are required to submit binary classification maps, and performance will be evaluated using the intersection over union (IOU) score.
Competition Phases

This challenge aims to promote innovation in the detection of flood events and water bodies, as well as to provide objective and fair comparisons among methods. The ranking is based on quantitative accuracy parameters computed with respect to undisclosed test samples. Participants will be given a limited time to submit their segmentation maps after the competition starts. The contest will consist of two phases:
- Phase 1 (Development): Participants are provided with training data (which includes reference data) and validation data (without reference data until phase 1 concludes) to train and validate their algorithms. Participants can submit prediction results for the validation set to the codalab competition website to get feedback on the performance from April 15 to May 14, 2021. The performance of the best submission from each account will be displayed on the leaderboard.
- Phase 2 (Test): Participants receive the validation set reference data for model tuning and test data set (without the corresponding reference data) to generate predictions and submit their binary classification maps in numpy array format from May 15 to June 30, 2021. After evaluation of the results, three winners will be announced on July 1, 2021.
Calendar
| Date | Phase | Event |
|---|---|---|
| April 14th | ^ | Contest opening |
| April 15th | Development (Phase 1) | Release of training data with references and validation data without references, evaluation of submissions for validation data set begins |
| May 15th | x | Release of test data and validation references for model tuning, evaluation of test submissions begins |
| June 15th | Test (Phase 2) | Evaluation of submissions stops |
| July 16th | v | Winner announcement |
The Data
The contest dataset is composed of 66,810 (33,405 x 2 VV & VH polarization) tiles of 256×256 pixels, distributed respectively across the training, validation and test sets as follows: 33,405, 10,400, and 12,348 tiles for each polarization. Each tile includes 3 RGB channels which have been converted by tiling 54 labeled GeoTIFF files generated from Sentinel-1 C-band synthetic aperture radar (SAR) imagery data using Hybrid Pluggable Processing Pipeline “hyp3”. Training tiles correspond to intensity values for VV and VH polarization with the following attributes.
- File name prefix:
<region>_<datetime>*_x-*_y-*_<vv | vh>.png - Size : 5.3 GB (uint8)
- Number of images : 66,810
- Acquisition mode : Interferometric Wide Swath
- Native resolution : 5x20m
- User guide : link
Semantic Labels
The provided training data is split across 29 root folders named <region>_<datetime>*, region being the region and datetime being the date and time of the flood event. Each root folder includes 4 sub-folders: vv, vh, flood_label and water_body_label with 2,068 files each. vv and vh correspond to the satellite images listed earlier and images in the flood_label and water_body_label folder provide reference ground truth.
Please note that the labeling has been performed as follows: The Hybrid Pluggable Processing Pipeline, “hyp3” system takes the Sentinel archive and creates a set of processes to get to a consistent method of generating the VV/VH amplitude or power imagery. The imagery is then converted to a 0 - 255 grayscale image. Total of 54 labeled GeoTIFF files from regions converted into tiles:
- Nebraska (1,741 sq. km.)
- North Alabama (13,789 sq. km.)
- Bangladesh (7,150 sq. km.) in
- Red River North (6,746 sq. km.)
- Florence (7,197 sq. km.)
Each TIFF is converted to multiple 256x256 tiles (scenes) The reference ground truth file is 256×256 pixels large. The pixel values (0 or 1) correspond to the two following classes:
- For flood labels:
- 0: Flood not present
- 1: Flood present
- For water body labels:
- 0: Land
- 1: Water body
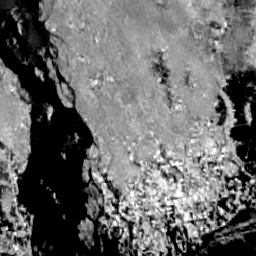
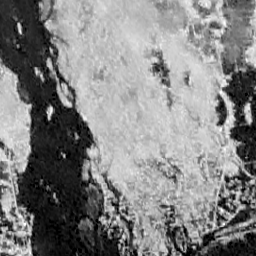
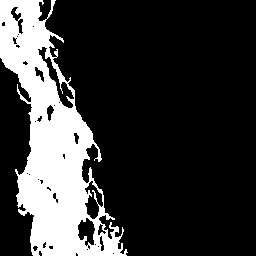
Visual examples of the training data and the high-resolution segmentation map used in the contest are shown in Figure 1.
 |
 |
 |
 |
|---|---|---|---|
| (a) Sentinel-1 image (Grayscale: VV) | (b) Sentinel-1 image (Grayscale: VH) | (c) Reference flood data (Grayscale) | (d) Reference water body data (Grayscale) |
Figure 1: Visual examples of satellite images (a), (b) and reference data (c) and (d) used in ETCI 2021.
We expect participants to provide a binary segmentation of the region of interest (ROI), (i.e. 256x256 pixels) as a numpy arra with the byte (uint8) data type:
- 1: Flood region
- 0: Not flood region
The reference data for the validation remain undisclosed until phase 1 concludes howeveer reference data for the test set remains undisclosed and will be used for the evaluation of the results.
Results:
The first, second, third, and fourth-ranked teams in the ECTI competition will be declared after code review as winners.
The rules of the game:
- All data can be requested by registering for the contest at Codalab website.
- To enter the contest, participants must read and accept the contest terms and conditions.
- For sake of visual comparability of the results, all segmentation maps shown in figures.
- Participants are required to generate binary segmentation maps in raster format (similar to the PNG files of the training set) and convert them into a numpy array for submission.
-
The segmentation results (prediction labels) will be submitted to the CodaLab competition website for evaluation as:
- (10400, 256, 256) (# of files, w, h) numpy array for Phase 1 (validation files sequence), and
- (12348, 256, 256) (# of files, w, h) for Phase 2 (test files sequence) respectively.
-
Make sure the prediction labels are sorted in an ascending order as shown in the following links before converting them into a numpy array.
- Validation files sequence (Phase 1): validation
- Test files sequence (Phase 2): test
- Create a zip file for submission.
- Ranking between the participants will be based on the IOU score.
- The maximum number of trials per team for the challenge is ten in the test phase.
- Submission will be accepted from April 15, 2021. Deadline for segmentation result submission is June 30, 2021, 23:59 UTC – 12 hours (e.g., April 15, 2021, 7:59 in New York City, 13:59 in Paris, or 19:59 in Beijing).
- Failure to follow any of these rules will automatically make the submission invalid, resulting in disqualification from the competition.
Acknowledgements
The ETCI competition chairs would like to thank the NASA Earth Science Data Systems Program, NASA Digital Transformation AI/ML thrust, and IEEE GRSS.
 |
 |
 |
Contest Terms and Conditions
The data are provided for the purpose of participation in the 2021 ETCI competition. Any scientific publication using the data shall include a section “Acknowledgement”. This section shall include the following sentence: “The authors would like to thank the NASA Earth Science Data Systems Program, NASA Digital Transformation AI/ML thrust, and IEEE GRSS for organizing the ETCI competition”.
FAQs
Q. Are there any edge cases in the dataset?
A. Yes, the cropped images are acquired from GeoTIFFs which don’t exactly align with a sliding crop window at the edges which causes artifacts in those cropped VV/VH images resulting in almost completely white images. However, they may still have flood / water body label because they are acquired from a different process. You may treat these images as noise.
Q. Are there any upload limits?
A. For Phase 1 & 2: The maximum submission limit is 10 per day and the total number of submissions that can be made is 100.
Results:
| Position | Participant or Team name | IOU |
|---|---|---|
| 1st | Team Arren (Xidian University) | 0.7681 |
| 2nd | Siddha Ganju (NVIDIA) & Sayak Paul (Carted) | 0.7654 |
| 3rd | Shagun Garg (GFZ Postdam) | 0.7506 |