import rioxarray
import stackstac
from pystac_client import Client
import xarray as xrTime series using rioxarray and stackstac
This notebook demonstrates how to generate a timeseries via rioxarray, pystac_client and stackstac.
- Author: Aimee Barciauskas
- Lasted Updated Date: August 3, 2022
Accessing the data
The data is in a protected bucket. Please request access by emailng aimee@developmentseed.org providing your affiliation, interest in or expected use of the dataset, and an AWS IAM role or user Amazon Resource Name (ARN). Once you have provided the role you will use to access the data, the team will add that role or user ARN to the permitted list of identities which can assume a role with read access to the data. The code in create_rio_session.py can then be used to assume this read-access role, identified in that code by the environment variable AWS_ROLE.
# Skip this if running in AWS Sagemaker
%run -i 'create_rio_session.py'
Declare your collection of interest
You can discover available collections the following ways:
- Use the
{STAC_API_URL}/collectionsAPI endpoint (JSON response) - Programmatically using
pystac(see example in thelist-collections.ipynbnotebook - In the STAC Browser: http://delta-staging-stac-browser.s3-website-us-east-1.amazonaws.com/
STAC_API_URL = 'https://staging-stac.delta-backend.com/'
collection = 'no2-monthly'
Use satsearch to discover items in the no2-monthly collection for China
china_bbox = [
    73.675,
    18.198,
    135.026,
    53.459
]
datetime = "2000-01-01T00:00:00Z/2022-01-02T00:00:00Z"
client = Client.open(STAC_API_URL)

search = client.search(
    bbox=china_bbox,
    datetime=datetime,
    collections=[collection],
    limit=1000
)
items = list(search.items())len(items)73Create an xarray.DataArray using stackstac
stack = stackstac.stack([item.to_dict() for item in items])
stack = stack.assign_coords({"time": stack.start_datetime})
stack
<xarray.DataArray 'stackstac-41ec520aa9a8d3b8a25c7c06a51c921c' (time: 73,
band: 1,
y: 1800, x: 3600)>
dask.array<fetch_raster_window, shape=(73, 1, 1800, 3600), dtype=float64, chunksize=(1, 1, 1024, 1024), chunktype=numpy.ndarray>
Coordinates: (12/13)
* time (time) <U20 '2022-01-01T00:00:00Z' ... '2016-01-01T00:00:...
id (time) <U45 'OMI_trno2_monthly_0.10x0.10_202201_Col3_V4.n...
* band (band) <U11 'cog_default'
* x (x) float64 -180.0 -179.9 -179.8 ... 179.7 179.8 179.9
* y (y) float64 90.0 89.9 89.8 89.7 ... -89.6 -89.7 -89.8 -89.9
start_datetime (time) <U20 '2022-01-01T00:00:00Z' ... '2016-01-01T00:00:...
... ...
proj:bbox object {180.0, -180.0, 90.0, -90.0}
end_datetime (time) <U20 '2022-01-31T00:00:00Z' ... '2016-01-31T00:00:...
proj:shape object {1800, 3600}
proj:transform object {0.1, 0.0, -0.1, 1.0, -180.0, 90.0}
proj:epsg int64 4326
epsg int64 4326
Attributes:
spec: RasterSpec(epsg=4326, bounds=(-180.0, -90.0, 180.0, 90.0), r...
crs: epsg:4326
transform: | 0.10, 0.00,-180.00|\n| 0.00,-0.10, 90.00|\n| 0.00, 0.00, 1...
resolution: 0.1Clip the data to the bounding box for China
# Subset to Bounding Box for China
subset = stack.rio.clip_box(
    minx=china_bbox[0],
    miny=china_bbox[1],
    maxx=china_bbox[2],
    maxy=china_bbox[3]
)
subset
/Users/leo/development-seed/veda/veda-documentation/env-veda-documentation/lib/python3.8/site-packages/rasterio/windows.py:310: RasterioDeprecationWarning: The height, width, and precision parameters are unused, deprecated, and will be removed in 2.0.0.
warnings.warn(<xarray.DataArray 'stackstac-41ec520aa9a8d3b8a25c7c06a51c921c' (time: 73,
band: 1,
y: 354, x: 614)>
dask.array<getitem, shape=(73, 1, 354, 614), dtype=float64, chunksize=(1, 1, 354, 535), chunktype=numpy.ndarray>
Coordinates: (12/14)
* time (time) <U20 '2022-01-01T00:00:00Z' ... '2016-01-01T00:00:...
id (time) <U45 'OMI_trno2_monthly_0.10x0.10_202201_Col3_V4.n...
* band (band) <U11 'cog_default'
* x (x) float64 73.7 73.8 73.9 74.0 ... 134.7 134.8 134.9 135.0
* y (y) float64 53.5 53.4 53.3 53.2 53.1 ... 18.5 18.4 18.3 18.2
start_datetime (time) <U20 '2022-01-01T00:00:00Z' ... '2016-01-01T00:00:...
... ...
end_datetime (time) <U20 '2022-01-31T00:00:00Z' ... '2016-01-31T00:00:...
proj:shape object {1800, 3600}
proj:transform object {0.1, 0.0, 1.0, -0.1, -180.0, 90.0}
proj:epsg int64 4326
epsg int64 4326
spatial_ref int64 0
Attributes:
spec: RasterSpec(epsg=4326, bounds=(-180.0, -90.0, 180.0, 90.0), r...
resolution: 0.1Select a band of data
There is just one band in this case, cog_default.
# select the band default
data_band = subset.sel(band='cog_default')
data_band
<xarray.DataArray 'stackstac-41ec520aa9a8d3b8a25c7c06a51c921c' (time: 73,
y: 354, x: 614)>
dask.array<getitem, shape=(73, 354, 614), dtype=float64, chunksize=(1, 354, 535), chunktype=numpy.ndarray>
Coordinates: (12/14)
* time (time) <U20 '2022-01-01T00:00:00Z' ... '2016-01-01T00:00:...
id (time) <U45 'OMI_trno2_monthly_0.10x0.10_202201_Col3_V4.n...
band <U11 'cog_default'
* x (x) float64 73.7 73.8 73.9 74.0 ... 134.7 134.8 134.9 135.0
* y (y) float64 53.5 53.4 53.3 53.2 53.1 ... 18.5 18.4 18.3 18.2
start_datetime (time) <U20 '2022-01-01T00:00:00Z' ... '2016-01-01T00:00:...
... ...
end_datetime (time) <U20 '2022-01-31T00:00:00Z' ... '2016-01-31T00:00:...
proj:shape object {1800, 3600}
proj:transform object {0.1, 0.0, 1.0, -0.1, -180.0, 90.0}
proj:epsg int64 4326
epsg int64 4326
spatial_ref int64 0
Attributes:
spec: RasterSpec(epsg=4326, bounds=(-180.0, -90.0, 180.0, 90.0), r...
resolution: 0.1# Group data into months
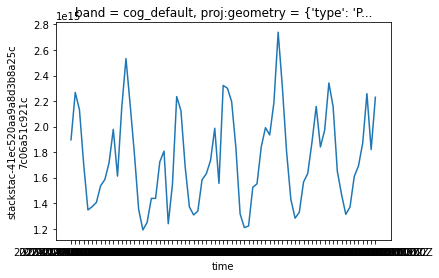
dates = data_band.groupby('time')# Average over entire spatial bounding box for each month
means = dates.mean(dim=('x', 'y'))means.plot()