Exploring the ImageLabeler
After logging in, users will be taken to the Earth science events directory. From here, they can use the navigation menu or begin interacting with the Earth science events.
Earth Science Events Directory
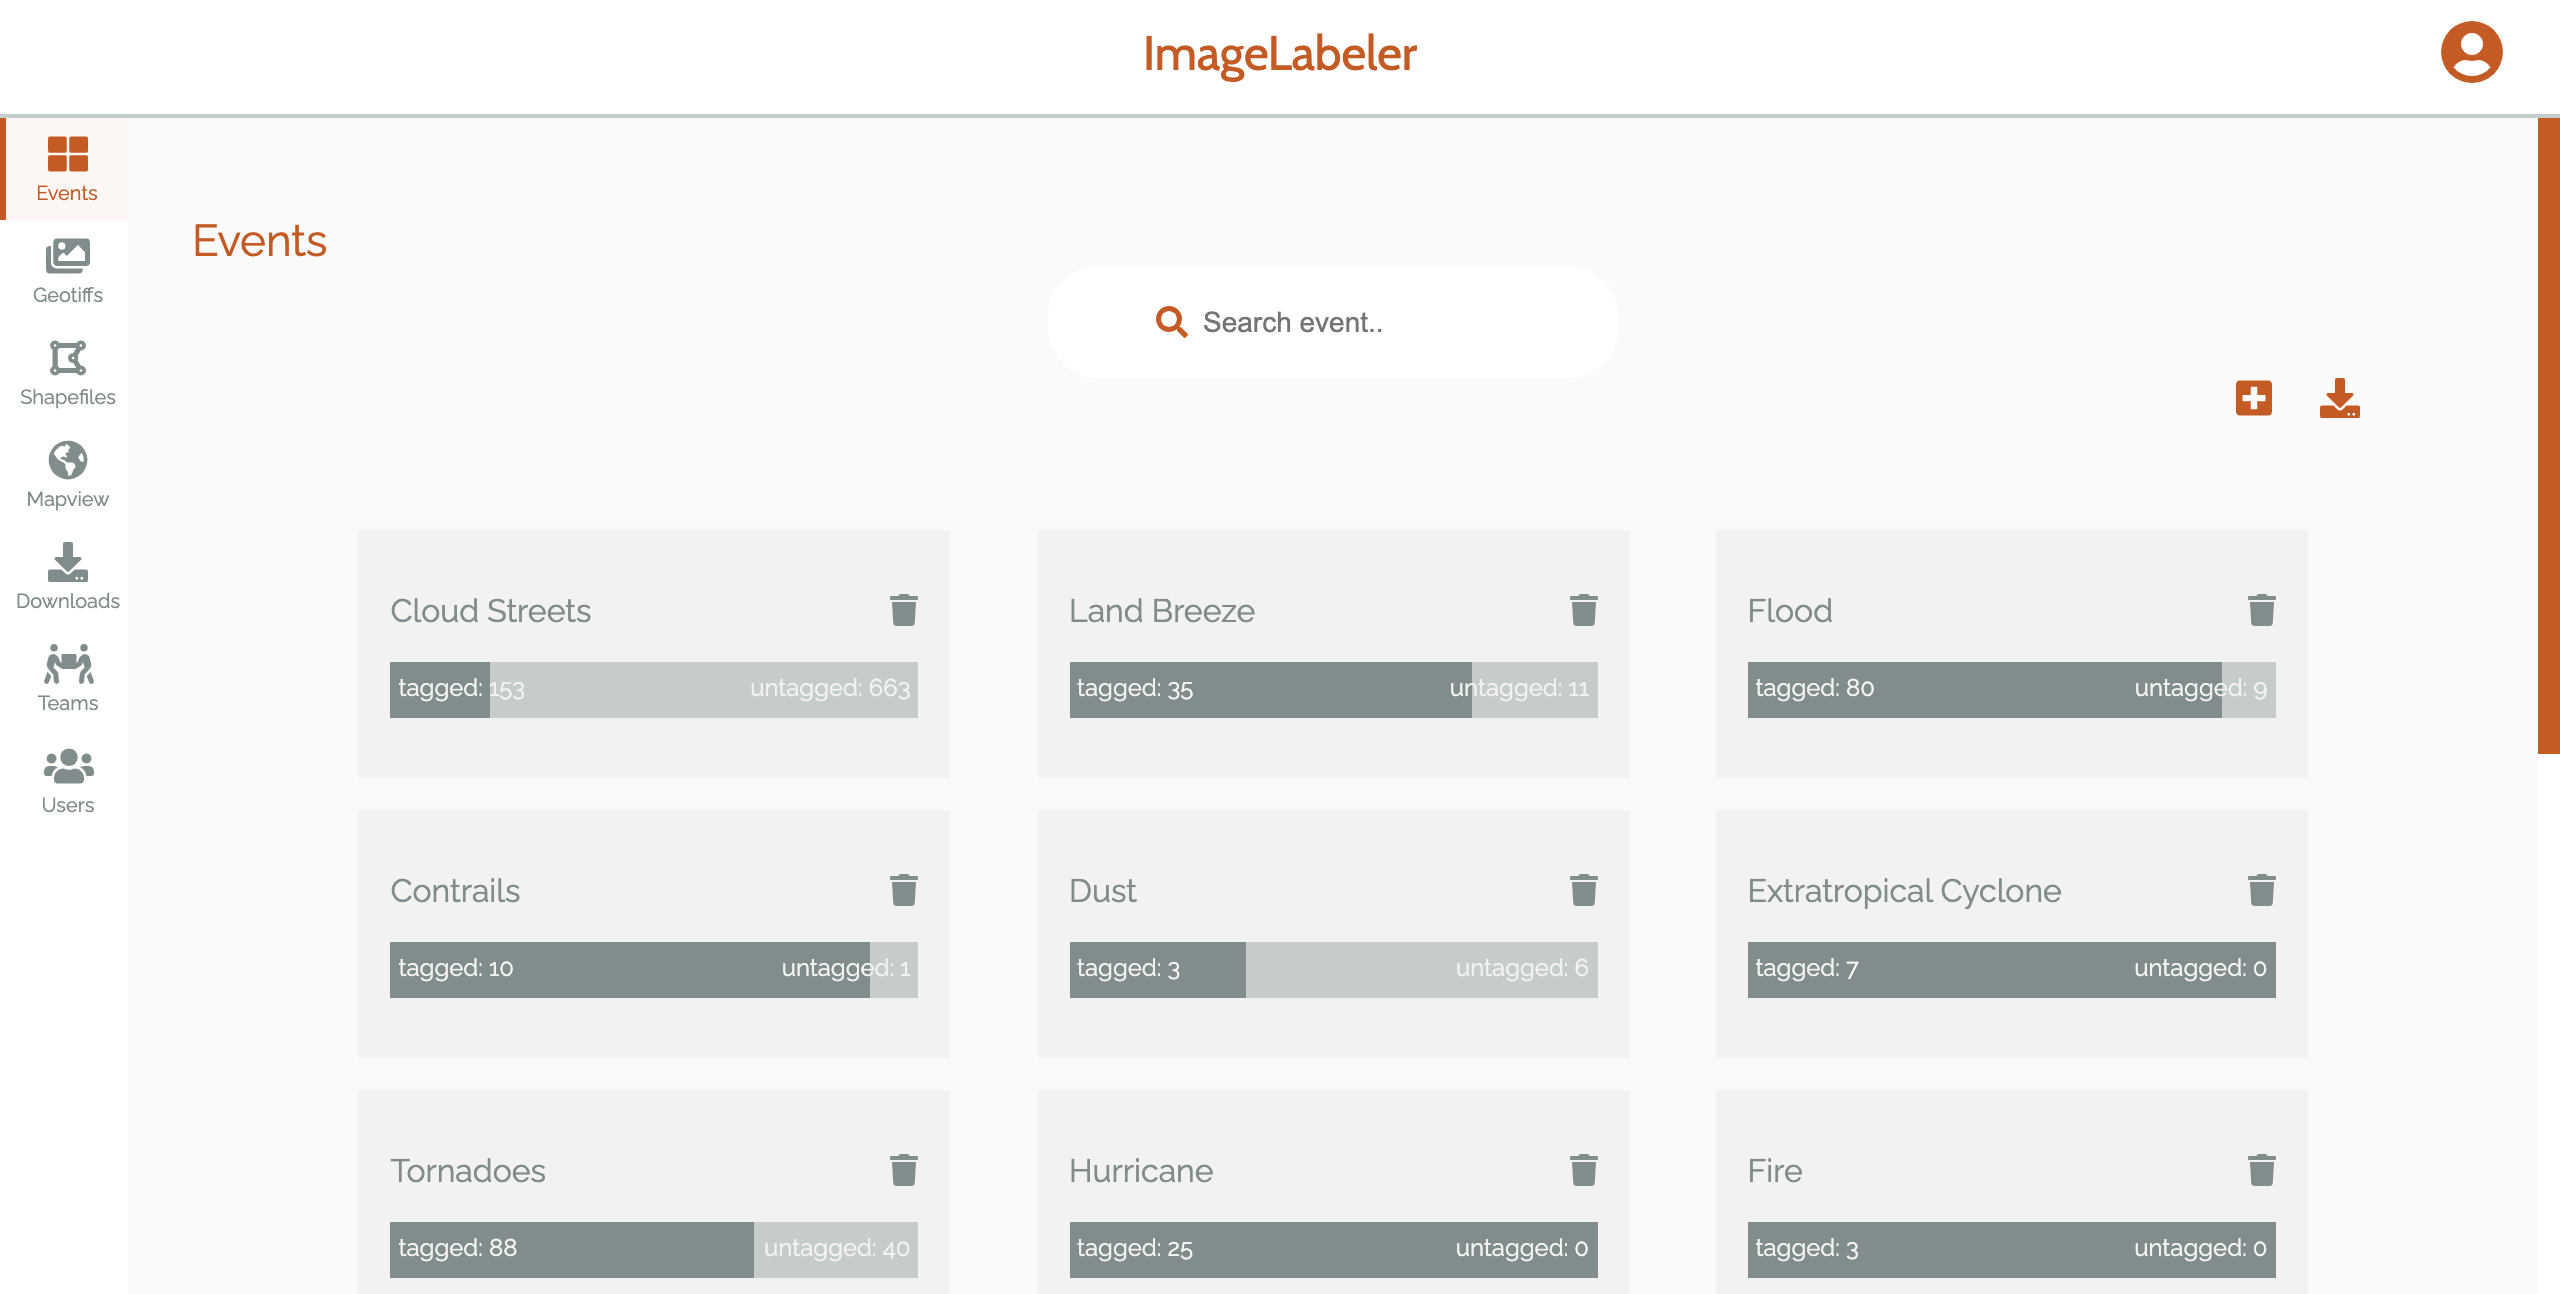
Figure 4: Earth Science Events Directory and program landing page
The Earth science events directory is the first page of the ImageLabeler application. It can be accessed at anytime by clicking on its icon  in the side menu.
The Earth science events directory provides a portal from which users can navigate into a specific Earth science event pages to tag, download, and upload images. Users can also access various download options from this page. Please note that there may be multiple pages of Earth science events, which can be sorted or searched. A user can download images for particular event by clicking the download  button and then selecting the tag status
  . The next option is to create an event, this is done by clicking the upload
  button to the left of the download button.
Users with administrator privileges will have additional options to add, edit, or delete events. A full description of these additional options can be found in the Admin Features section.
Event Pages
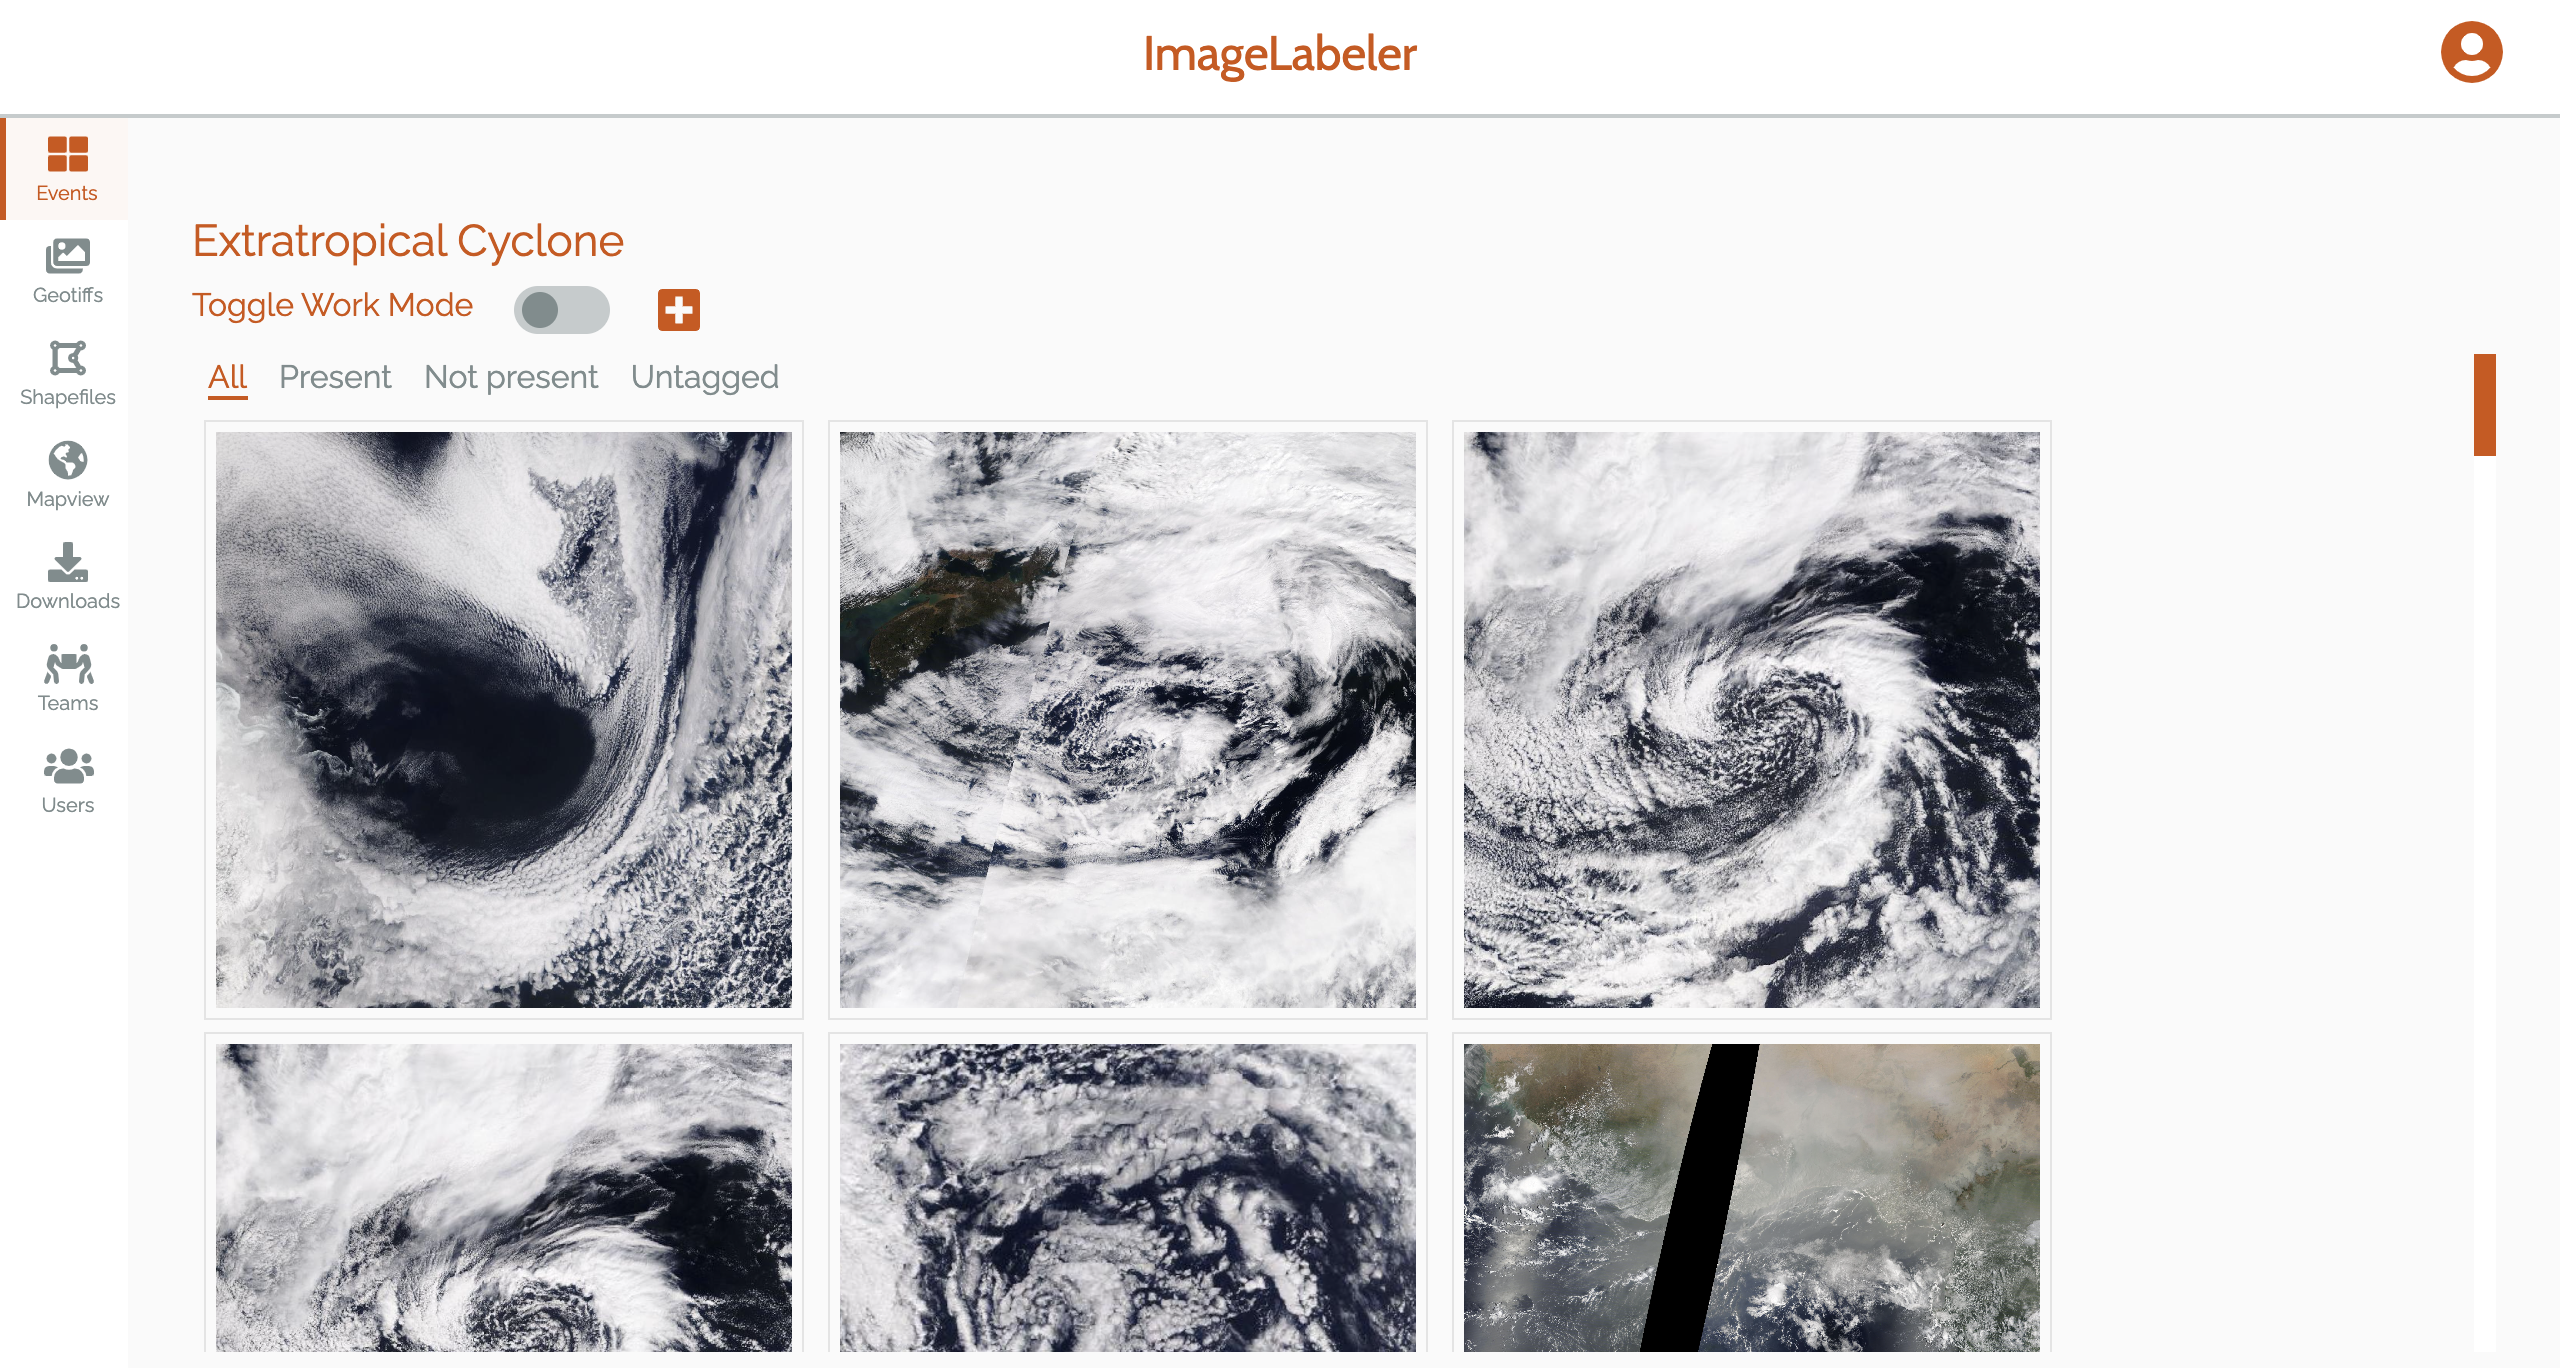
Figure 5: Event page (Work Mode off)
Specific Earth science event pages can be accessed by first navigating to the Earth science events directory and then selecting the desired Earth science event from the available events. For example, a user could click on the extratropical cyclone event(as shown in Figure 6). This action will take the user to the extratropical cyclone event page(shown in Figure 5). The next option is to upload an image to the event page, this is done by clicking the button to the right of the toggle button. The user can also delete an event using the  button.

Figure 6: Event card linked to Extratropical Cyclone event
From an event page (see Figure 5), users have the ability to download and upload images to that specific event. See the Downloading Data section for more detail.
The event page is also the main interface for tagging images. See the Tagging Images section for more detail.
Using Event Pages
An event page opens when the event associated with it is clicked on the Earth science events tab.

Figure 7: Example of an Earth science event page (Work Mode on)
When a user first lands on the event page they encounter several buttons they can use to work with the images associated with that particular event. If a user is a part of a team they will have a work mode  switch. This switch can be “on” or “off” indicating whether or not the person wants to work on tagging images or not. This switch also affects the view of the user. For example, if the user is not in work mode the option to mark an event as present or not present goes away. Work mode allows a user to either browse images in a more casual way or work on categorizing the images, whichever they prefer at the time. Please note that there may be multiple pages of images for some events, which can be sorted or searched. When clicking one or multiple images, a window with image details with multiple options for tagging is loaded.
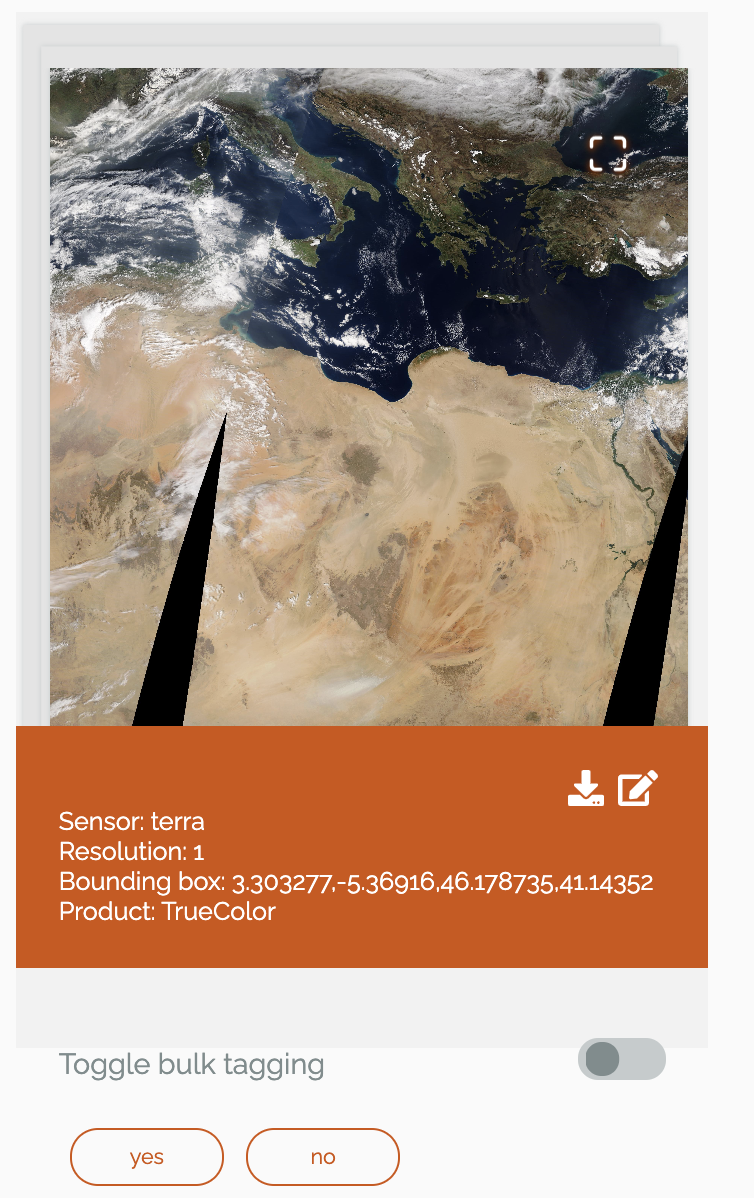
Figure 8: Window showing selected images with tagging options
A user can download a particular image by selecting the image and clicking the download button (shown in Figure 8). The user can select multiple images at once and enable bulk tagging using the toggle  to perform actions quicker. The user can also navigate the images using the
 buttons.
When a user is in work mode they can begin to tag images (tagging an image is defined in the Terminology section). A user can scroll through the images–there may be several pages to scroll through–and select the particular image they want to examine. If the user wants a better view of the image they can select the view full size  option on the top right corner of the selected image (shown in Figure 8). The user can minimize the image and return to event page by clicking on
  button. When an image is selected the user can tag the image by selecting if the event is present
  or not present
  in the image. When a user tags an image as present or not present the image is moved to either the Present or Not Present tab. Any images that have not been tagged remain in the Untagged tab. The metadata will only appear on images that have been tagged, meaning untagged images do not display metadata.

Figure 9: An image viewed in full size
The event page includes a series of tabs that sort the images according to their tag status. The tabs are listed underneath the name of the Earth science event. The tab that opens when the event is clicked is the  tab. This tab holds all of the extracted images for an even. If a user marks an image as having the event present, the image is sent to the
  tab. If a user marks an image as not having the event present then the image will be placed into the
  tab. The
  tab holds all of the extracted images that are marked for that event until they are tagged present or not present. These tabs will help users navigate through the images and keep them sorted.
Mapview
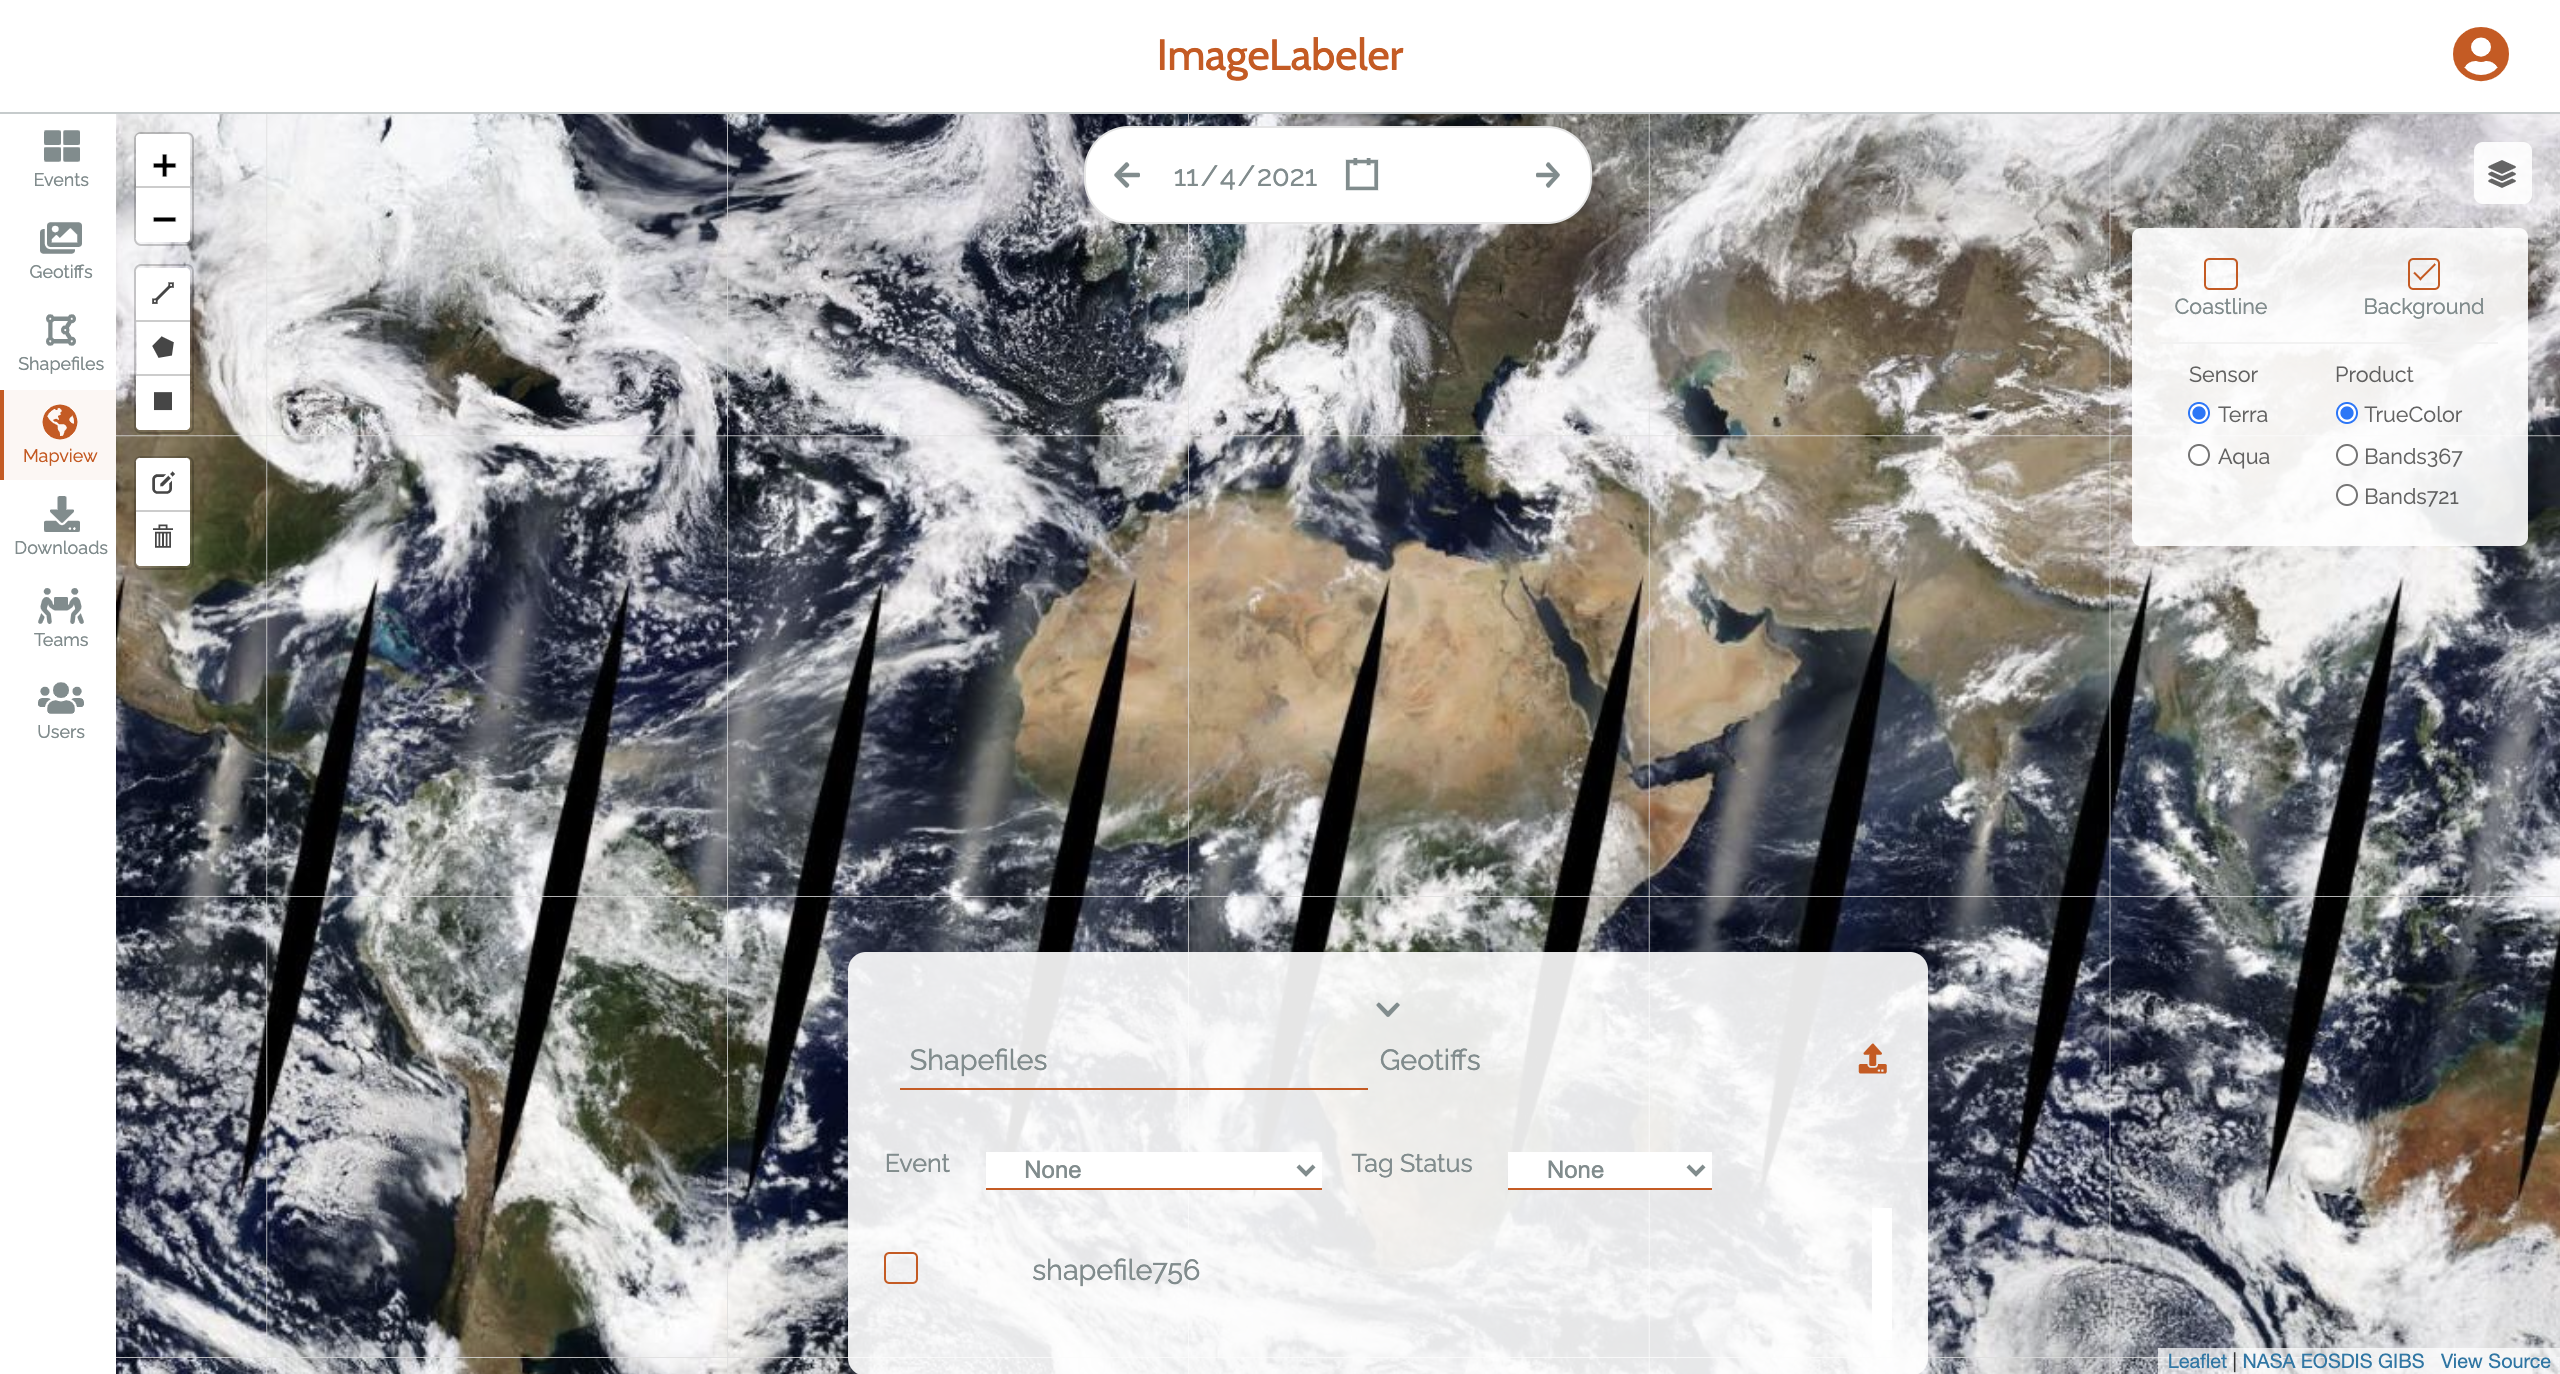
Figure 10: Mapview
The Mapview feature provides tools to interact with a worldwide map generated by satellite data (see Figure 10). Current and historic data is available, and users can click on  and select between various satellite instruments
  and data products
 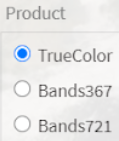 . Users can interact with the map and timeline to find Earth science events and then extract images using bounding boxes. User can view and
  upload
  and
and  for the selected date.
Using the GeoTIFFs Feature
When a user first accesses the GeoTIFFs feature they are shown the map with the default settings (Sensor: Aqua, Product: TrueColor, background checked, the current date’s map). The user can view the whole map on the screen or use the zoom icons  in the left-hand corner to get a closer view of an area. A user can also click and drag the map to view different areas of the map. The user has access to two menus, one on the left and one on the right. The left menu shows the other areas accessible to the user in ImageLabeler.
A user has the ability to change the output of the map to enhance their search for Earth science events. The user can access the tools to change the map in the right menu by clicking on the icon on the top-right corner of the screen. A user can configure the settings to any combination of sensors, products, or views along with background and coastlines options. These specific tools are explained in more detail in Changing Map Output and Selecting Images for Tagging sections.
Changing the map output is useful for identifying events that may not be visible under different settings. Different sensors and products show different combinations of outputs depending on how they are configured. These different outputs can provide a better view of a specific event if it was not clear enough under different settings.
The GeoTIFFs and shapefiles that a user draws on the map are maintained in the panel (shown in Figure 11) at the bottom of the screen that can be accessed by clicking on  . This information is kept until they are deleted using the Clear All option by clicking on the
  icon. A user can draw multiple boxes and polygons on the map and select which ones to view at any given point. The user can use event and tag status filter options to filter shapefiles.
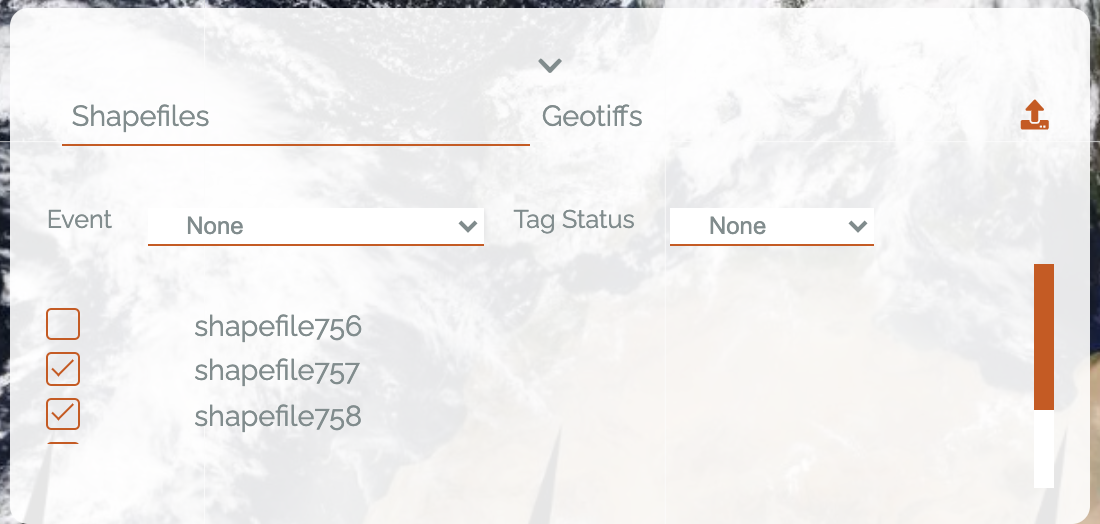
Figure 11: Panel showing the shapefiles and GeoTiffs for a given date
Once a user understands how to navigate the GeoTIFFs feature, they are ready to begin drawing bounding boxes or polygons to collect images. The ways to perform this action are covered in more detail in the section Selecting Images for Tagging. The action of collecting images involves initially identifying an event, using the tagging tools to capture the area of the event, and then tagging the image once it is extracted. The user can use the bounding boxes to download images and polygons/polylines to download shapefiles, this is covered in more detail in the Downloading Data section.
After navigating the map and gathering images of events, a user may want to clear all of the layers on top of the map. A layer contains the bounding boxes or polygons that a user has drawn on the map to capture an event. As mentioned previously, the user can clean up the map by selecting the icon. When this icon is selected the user is given the choice to save any edits, cancel their selection, or clear all of the layers. The user can select the icon and then click on a single layer to remove it from the map but keep the others. The user can also use the edit  icon to edit the layers they have on the map. This icon will let the user adjust the points of their bounding box or polygon to expand the area they want to capture. They have the option to save their changes or cancel the changes they have made since selecting the edit icon. On selecting a shapefile, additional options such as
  and
and  are displayed.
Changing Map Output

Figure 12: GeoTIFFs, zoomed in on an interesting cloud using historical data, Sensor: Terra, Product: Bands367
As seen in Figure 9, there are many user modifiable settings in the GeoTIFFs interface. These settings are located in the right menu, as discussed above. Users can configure the following settings before image extraction (the usability of each setting is described in the Selecting Images for Tagging section):
Date
Coastlines
Background
Date Range
Sensor
Product
Exploring the Map
The map can be explored by clicking and dragging to move, and then scrolling, double clicking, or using the icons to zoom in and out (as discussed above and shown in Figures 9 and 11).
Downloads
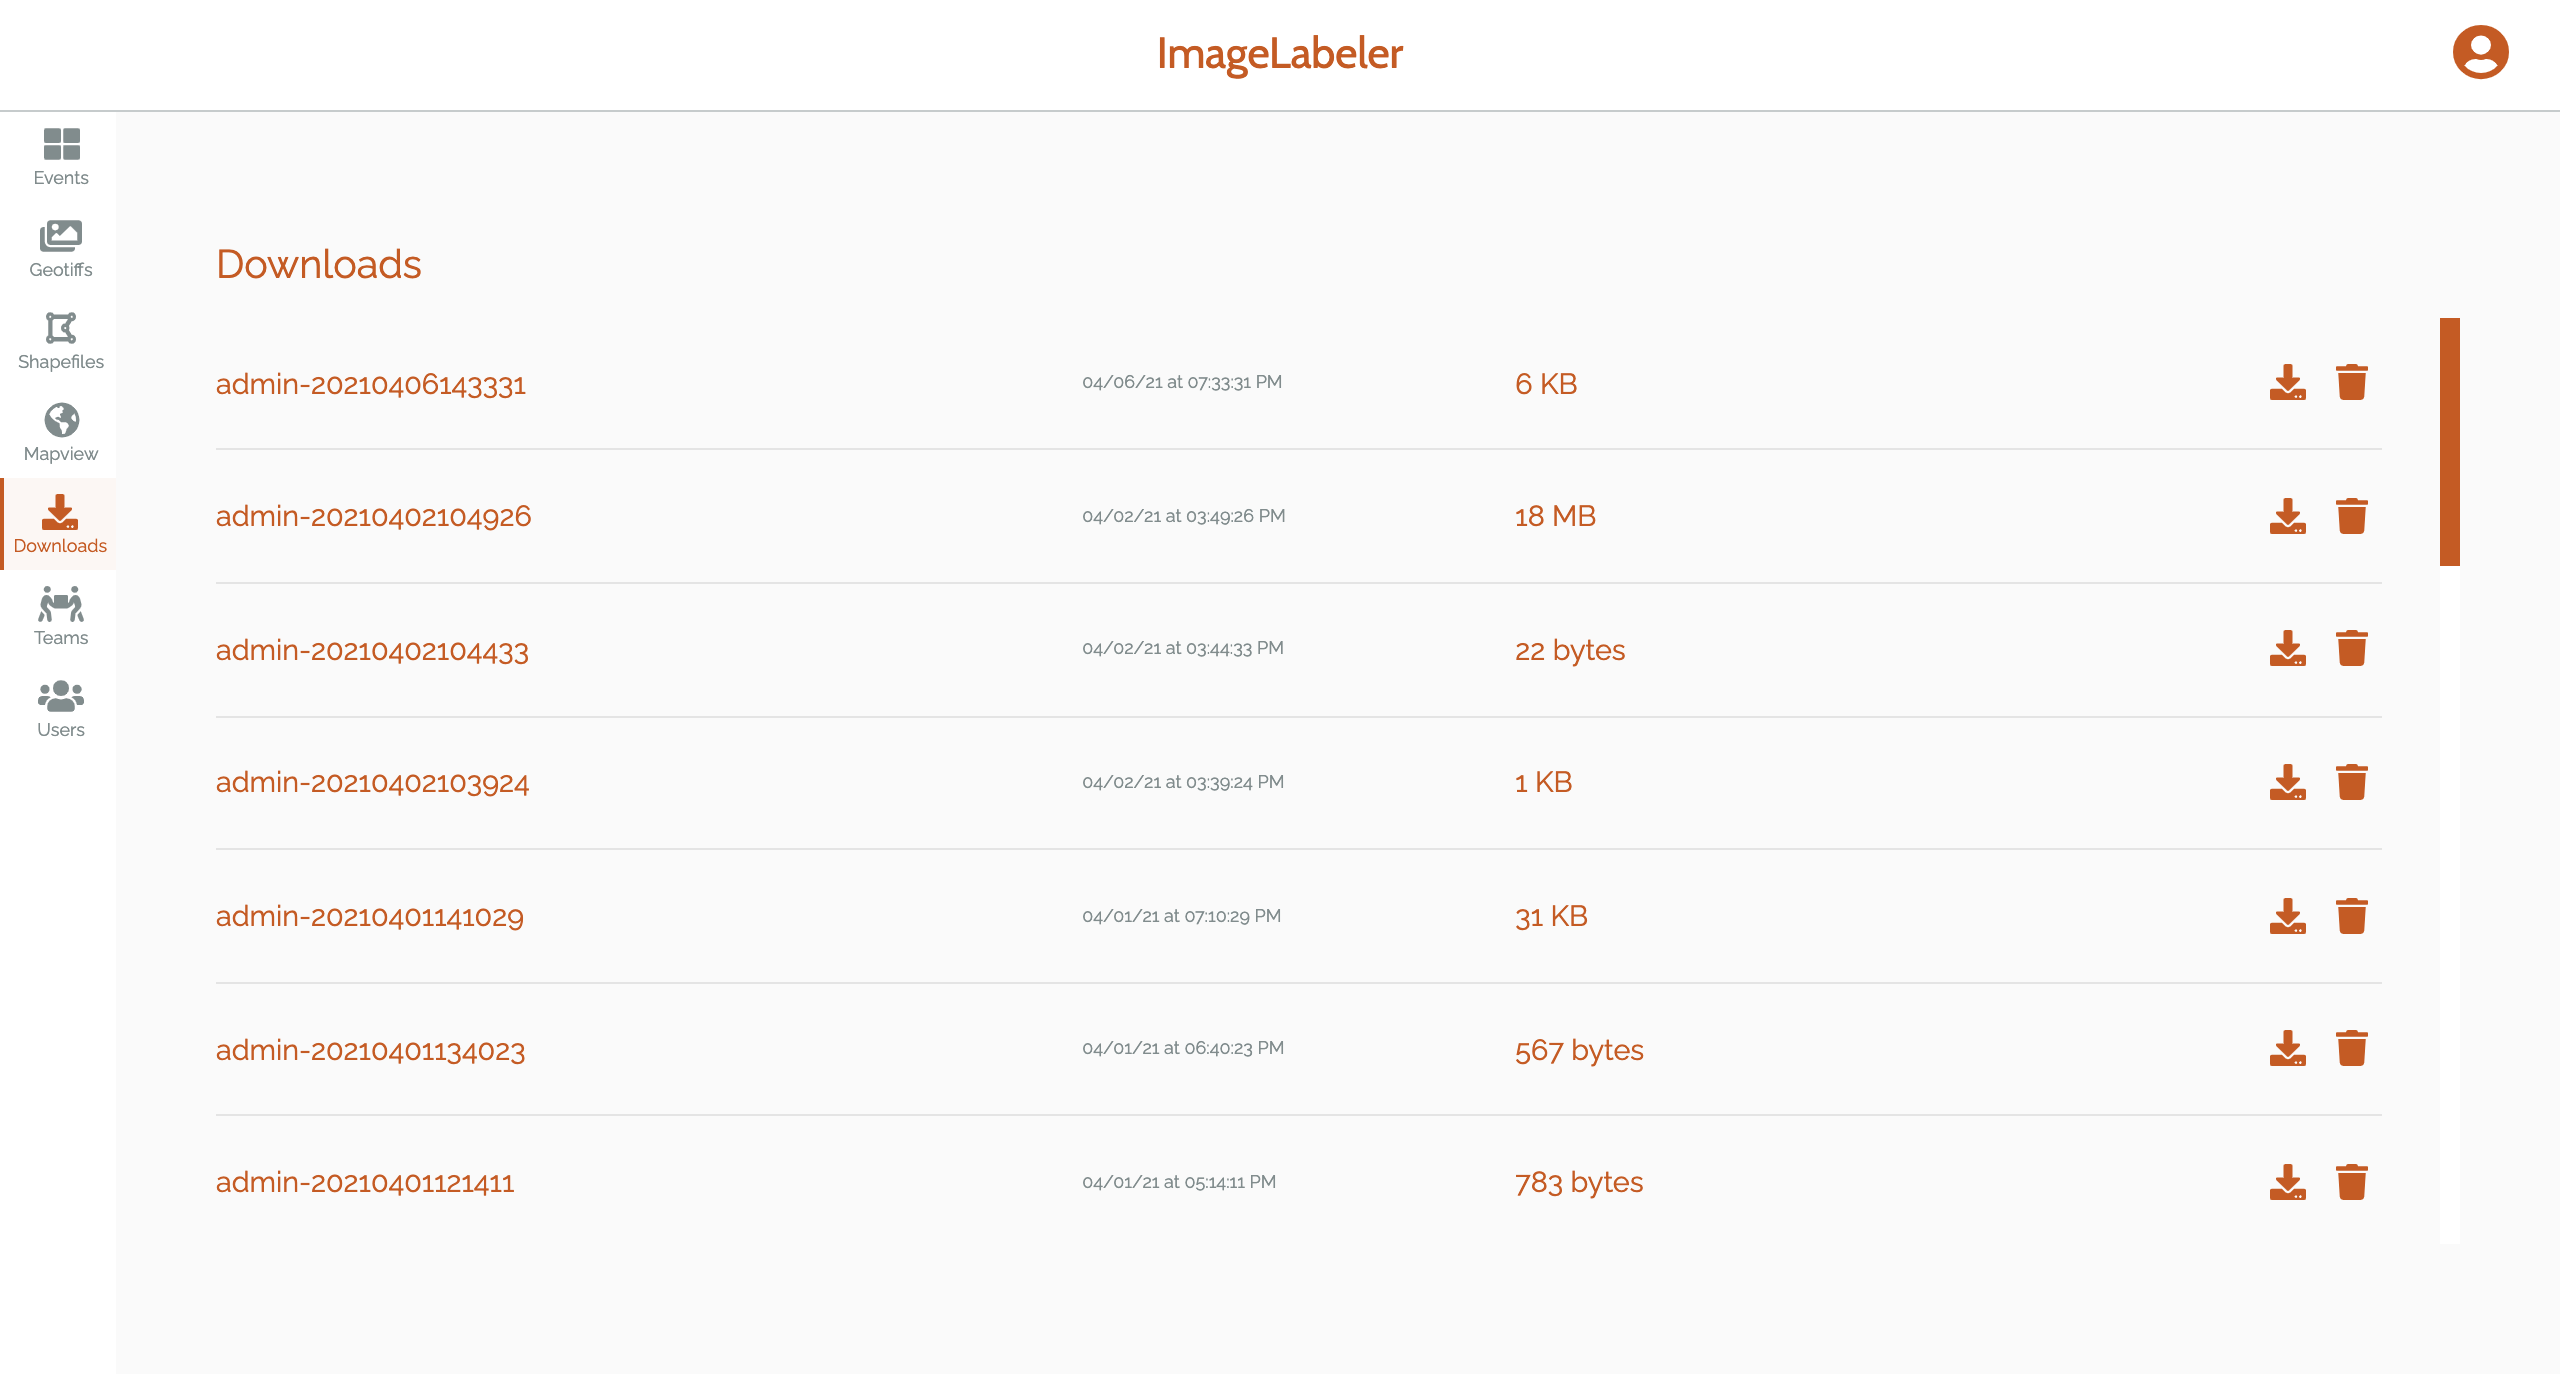
Figure 13: Downloads page
The Downloads page provides a list of past and ongoing downloads initiated by the user. For more details, see Downloading Data.